The Philosophical Developer — Chapter 17: Observability
2026-07-09 · 3 min read
Observability
All code for this series lives in the local-cloud repo on GitHub.
Last chapter we deployed workloads to the local k3s cluster. The deployment ran, the pods started, the service responded. But we had no idea what was happening inside.
A cluster without observability is a black box. You know it’s running until the moment it’s not, and then you have no data to tell you why.
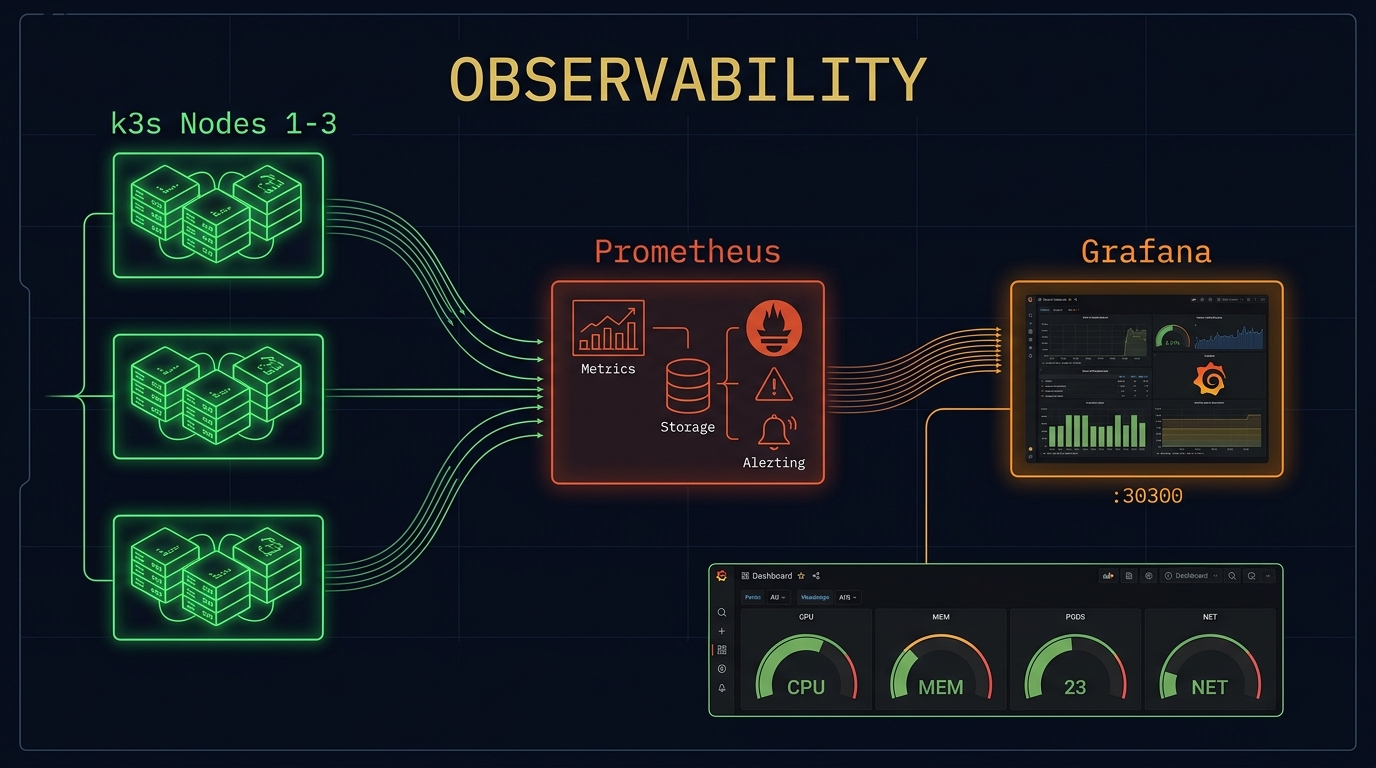
The Observability Stack
For the local cloud, we need three things:
- Metrics — Prometheus scrapes node, pod, and container metrics
- Visualization — Grafana turns metrics into dashboards
- Alerting — (future) Prometheus AlertManager for notifications
Deploying with Helm
The kube-prometheus-stack Helm chart bundles all three. It’s the standard way to deploy monitoring on Kubernetes.
helm repo add prometheus-community https://prometheus-community.github.io/helm-charts
helm repo update

helm install monitoring prometheus-community/kube-prometheus-stack \
  --namespace monitoring \
  --create-namespace \
  --values monitoring-values.yaml
The Values File
The monitoring stack needs to be configured for a local development environment — no persistent storage, reduced resource limits, and NodePort access for Grafana:
grafana:
  adminPassword: local-dev
  service:
    type: NodePort
    nodePort: 30300
  persistence:
    enabled: false
  dashboards:
    default:
      local-cloud:
        url: https://raw.githubusercontent.com/dark5un/local-cloud/main/monitoring/dashboards/local-cloud.json

prometheus:
  prometheusSpec:
    retention: 24h
    resources:
      requests:
        memory: 256Mi
      limits:
        memory: 1Gi

alertmanager:
  enabled: false
The Local Cloud Dashboard
A custom Grafana dashboard shows the cluster’s health at a glance:
- Cluster overview — node count, CPU, memory, disk
- Pod health — running vs pending vs failed pods
- Namespace breakdown — resource usage per namespace
- Network traffic — bytes in/out per node
Verifying
# Check all pods are running
kubectl -n monitoring get pods

# Access Grafana
kubectl -n monitoring get svc monitoring-grafana
# Open http://localhost:30300 in your browser
# Login: admin / local-dev
What Observability Teaches
Adding observability to the local cloud changes how you work:
Before: You deploy and hope. When something breaks, you start from zero.
After: You deploy and watch. The dashboard shows you CPU spikes, memory pressure, failed probes. You know where to look.
The local cloud is now a complete platform:
- Infrastructure — OpenTofu modules with TDD
- Compute — k3s Kubernetes + Floci AWS emulation
- CI/CD — Dagger pipeline with automated validation
- Observability — Prometheus metrics + Grafana dashboards
Cleaning Up
helm uninstall monitoring --namespace monitoring
kubectl delete ns monitoring
The Series So Far
| Chapter | Topic | Weight |
|---|---|---|
| 13 | Local Matters — Floci, k3s, Docker, k3d | 220 |
| 14 | Code Your Infrastructure — OpenTofu TDD | 225 |
| 15 | The Pipeline — Dagger + GitHub Actions | 230 |
| 16 | Deploy to the Local Cloud — k8s module | 235 |
| 17 | Observability — Prometheus + Grafana | 240 |
The local cloud is reproducible, traceable, testable, and safe. It runs on a single machine, validated by an automated pipeline, and visible through live dashboards.
That’s the point. Local-first cloud infrastructure is not a compromise. It’s a foundation.
Also on LinkedIn.