The Philosophical Developer -- Chapter 35: The CI Watcher
2026-07-22 · 4 min read
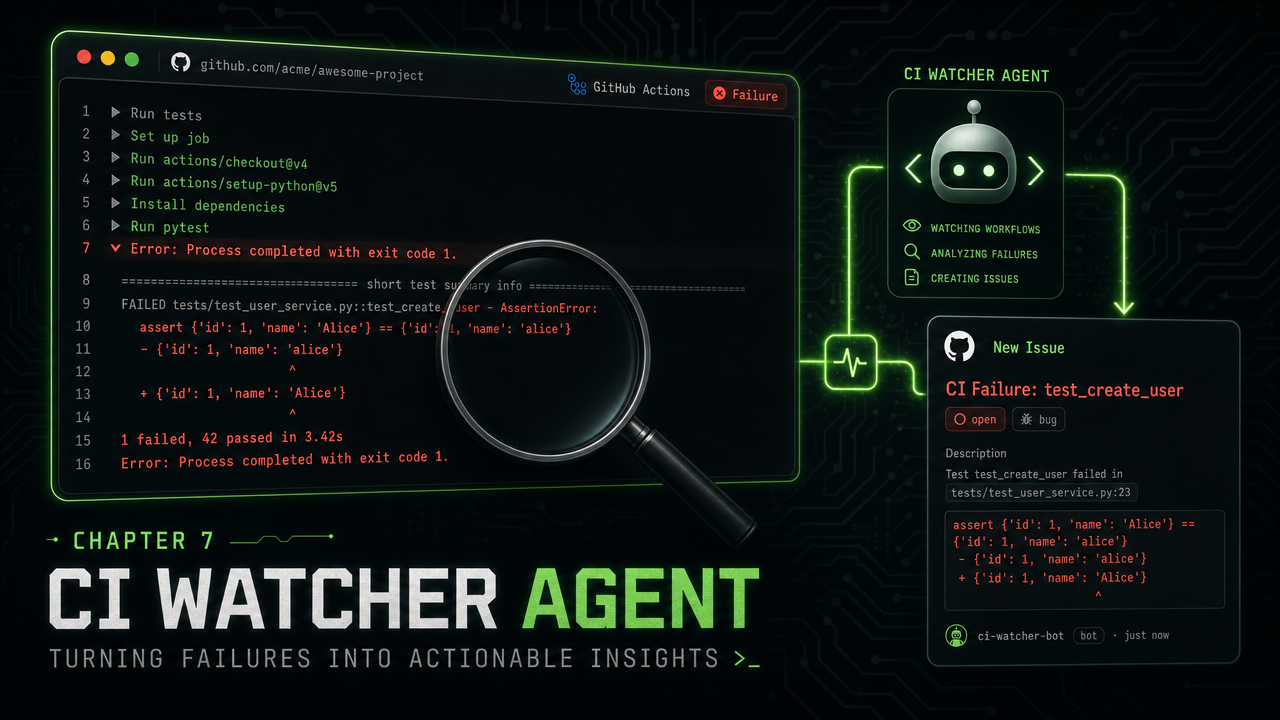
Chapter 34 designed the watchtower. The four-stage loop, the issue as state machine, the Concourse-inspired credential isolation. It was all theory and architecture.
This chapter proves it works.
The Setup
The sre-watchtower repo has three workflows. The CI workflow runs the test suite on every push. The flaky-test workflow is a deliberately failing job that simulates a real CI failure. The responder workflow fires on workflow_run completion and creates a GitHub Issue when a run fails.
The responder needs one thing to work: the sre-watchtower label must exist in the repo. Without it, the issue creation fails. That was the first bug we hit.
The responder also needs explicit permissions: issues: write in the workflow YAML. The default GITHUB_TOKEN in a workflow_run event does not have write access to issues. That was the second bug.
Both bugs were one-line fixes. Both were caught by running the system end-to-end. This is the value of the dry-run approach – you find the configuration gaps before you need the system to work for real.
The Cycle
I triggered the flaky-test workflow manually with gh workflow run. The workflow ran, printed an error message, and exited with code 1.
GitHub’s workflow_run event fired. The responder workflow started, checked for an existing issue with the same run_id (deduplication), found none, and created issue #3 with the sre-watchtower label.
The issue body was a JSON document:
{
  "run_id": "29910677338",
  "workflow": "Flaky Test",
  "branch": "main",
  "commit": "1ec0a437...",
  "status": "pending"
}
The status: pending field is the signal. The agent polls for open issues with the sre-watchtower label. When it finds one with status: pending, it starts the four-stage loop.
The Agent
The agent runs locally. One command:
export GITHUB_TOKEN=$(gh auth token)
export WATCHTOWER_REPO="dark5un/sre-watchtower"
uv run python -m sre_watchtower.cli
The agent found issue #3, saw status: pending, and started.
Stage 1: Acknowledge. The agent posted a comment: “Watchtower investigating: run Flaky Test (branch main)”. It updated the issue status to investigating.
Stage 2: Investigate. The agent fetched the workflow run logs via the GitHub API. The API returns a zip archive of log files. The agent extracts the zip, reads the text, and passes it to the investigator.
The investigator runs pattern matching against the logs. No LLM is configured for this first test – the fallback heuristic analyzer handles it. The patterns are ordered from most specific to least specific so that “connection pool exhausted” matches before the more generic “connection refused”.
Stage 3: Report. The agent posted a structured comment on the issue:
## Investigation Report

**Workflow:** Flaky Test
**Branch:** main
**Run ID:** 29910677338
**Conclusion:** failure

### Root Cause

Database connection pool exhausted

**Severity:** high

### Recommendation

Restart the database service or increase pool size

### Evidence

- Found pattern: 'connection pool exhausted' in logs
Stage 4: Resolve. The agent updated the issue status to resolved because the root cause was identified and the severity was high enough to trigger the resolution path.
What We Proved
The full cycle worked end-to-end. Pipeline failed, issue created, agent acknowledged, agent investigated, agent reported, issue resolved. No human intervention.
The cycle used only free services. GitHub Actions, GitHub Issues, GitHub API. No paid monitoring, no paid alerting, no paid LLM. The agent ran on the local machine. The credentials never left the environment.
The test suite covers the deterministic parts. 18 tests, all passing, all using mocks for the GitHub API and the LLM. The tests run in 30 milliseconds. The CI pipeline verifies them on every push.
What Comes Next
The fallback analyzer is a starting point. It catches known patterns. The real power comes when an LLM is connected – the investigator can then correlate across multiple log sources, understand novel error patterns, and write richer reports.
The next chapter connects the LLM. It also extends the watchtower to production monitoring with Prometheus and Alertmanager.
Here I geek out with my young Padawan, OrsonRius.
Repos:
LinkedIn: