The Philosophical Developer -- Chapter 36: The Production Watcher
2026-07-22 · 5 min read
The CI watcher proved the loop. Pipeline fails, issue created, agent investigates, agent reports. The cycle works for development infrastructure.
But CI is the easy case. Failures are deterministic. Logs are structured. The scope is bounded – one workflow, one commit, one branch.
Production is harder. Alerts fire from multiple sources. Metrics are noisy. Correlation across services is the actual job. The watchtower needs to handle ambiguity, not just pattern matching.
The Production Architecture
The production watcher extends the same four-stage loop, but the data sources change.
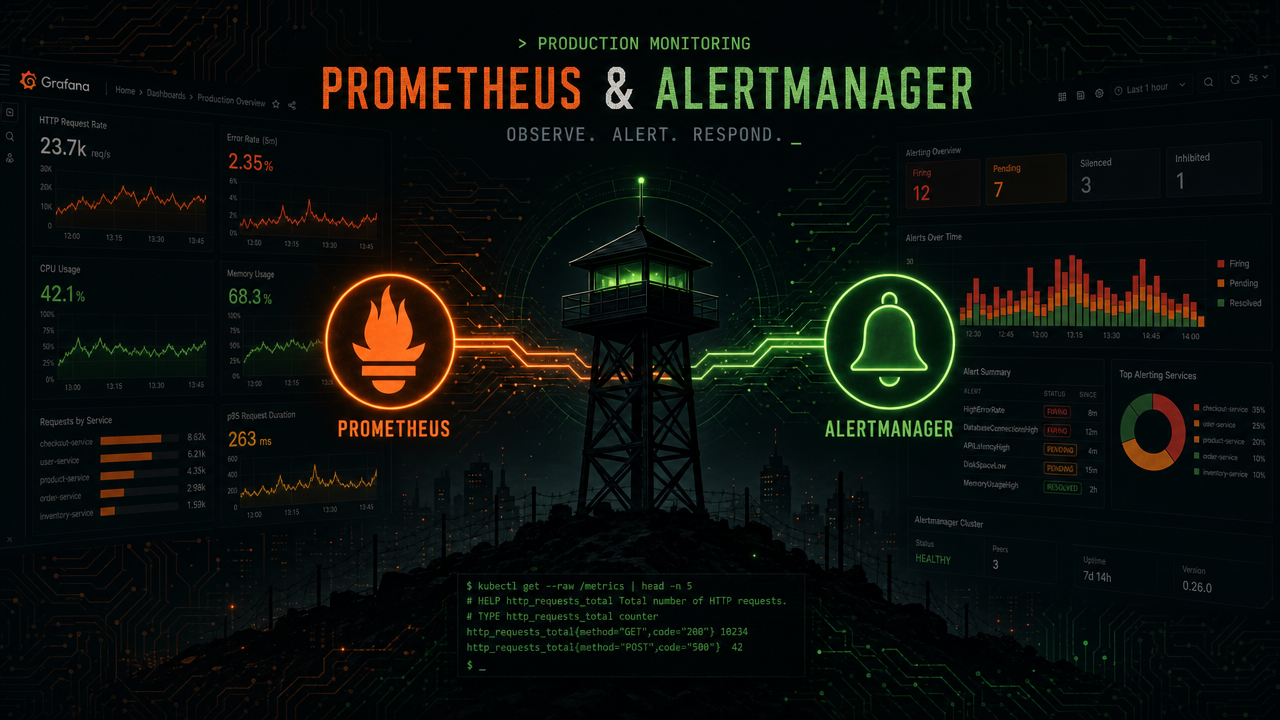
Watch. Prometheus fires an alert. Alertmanager sends a webhook to a local endpoint. The endpoint creates a GitHub Issue with the sre-watchtower label, same as the CI responder.
The issue body carries the alert context:
{
  "alertname": "HighErrorRate",
  "severity": "critical",
  "service": "api-gateway",
  "summary": "Error rate above 5% for 5 minutes",
  "status": "pending",
  "firing_since": "2026-07-22T10:00:00Z"
}
Acknowledge. The agent sees the issue, posts a comment, and transitions the status to investigating. The Alertmanager webhook fires instantly. The agent polls every 2 minutes. The worst-case latency is 2 minutes plus the investigation time.
Investigate. The agent queries the Prometheus API for related metrics. If the alert is HighErrorRate on the api-gateway service, the agent queries:
- Error rate over the last 15 minutes
- Request latency (p50, p95, p99) over the last 15 minutes
- Recent deployments (via the GitHub API – check for workflow runs in the last hour)
- CPU and memory usage on the affected service
The LLM correlates these signals. “Error rate spiked 3 minutes after a deployment. The deployment changed the database connection pool configuration. The pool size was reduced from 20 to 5. This matches the error pattern.”
Report. The agent writes a structured incident report on the issue, same format as the CI watcher. Root cause, severity, recommendation, evidence.
The Alertmanager Webhook
The webhook receiver is a small Python endpoint that runs locally. It receives the Alertmanager payload, creates a GitHub Issue, and exits. Same pattern as the CI responder – the receiver is a thin adapter, not an agent.
from http.server import HTTPServer, BaseHTTPRequestHandler
import json, os

class WebhookHandler(BaseHTTPRequestHandler):
    def do_POST(self):
        body = json.loads(self.rfile.read(int(self.headers['Content-Length'])))
        for alert in body.get('alerts', []):
            create_issue(alert)  # calls GitHub API
        self.send_response(201)
        self.end_headers()

HTTPServer(('127.0.0.1', 9099), WebhookHandler).serve_forever()
The receiver runs as a systemd user service. It is not the agent. It is the bridge between Alertmanager and GitHub Issues.
The LLM Integration
The production watcher needs the LLM. Pattern matching is not enough for production incidents. The LLM correlates across metric sources, understands deployment history, and writes richer reports.
The LLM key lives in the local environment. The agent reads it from WATCHTOWER_LLM_KEY. The key is never in the repo, never in the workflow, never in the issue. The agent calls the LLM API locally, processes the response, and writes the report to the issue.
The LLM call is behind the LLMClient interface. The tests mock it. The fallback analyzer handles the case where no LLM is configured. The system degrades gracefully.
The Manifest
The production watcher is configured in the same manifest:
production_watcher:
  enabled: true
  alertmanager: http://localhost:9093
  prometheus: http://localhost:9090
  webhook_port: 9099
  interval: "*/2 * * * *"
  acknowledge: telegram
  max_actions:
    - report
The max_actions field is the safety boundary. Production starts with report only. The agent investigates and reports. It does not trigger workflows. It does not roll back. It does not restart services.
When we trust the agent, we add trigger_workflow. The agent can then trigger a rollback workflow. The workflow runs in GitHub Actions, not locally. The agent triggers it, monitors it, and reports the outcome. The credentials stay in the pipeline.
The Two Worlds
The CI watcher and the production watcher share the same codebase, the same agent loop, the same issue state machine. The only difference is the data source.
CI: GitHub Actions workflow failure -> GitHub Issue -> agent investigates logs. Production: Prometheus alert -> Alertmanager webhook -> GitHub Issue -> agent investigates metrics.
The methodology holds. The four pillars carry over. Test-first: the agent code is tested with mocks. Mock-driven: the LLM and the GitHub API are both behind interfaces. Composable: the CI watcher and the production watcher compose from the same components. CI-verified: the test suite runs on every push.
What We Did Not Build (Yet)
The production watcher is designed but not yet deployed against a real Prometheus instance. The local-cloud infrastructure does not currently run Prometheus. The next step is to deploy Prometheus and Alertmanager alongside the Pulumi infrastructure, wire up a few basic alerts, and let the agent handle real production signals.
That is a future chapter. For now, the design is proven. The CI watcher works end-to-end. The production watcher is architecturally ready. The methodology transfers from infrastructure to operations.
Here I geek out with my young Padawan, OrsonRius.
Repos:
LinkedIn: