The Philosophical Developer — Chapter 59: The Dashboard That Had to Prove Itself
2026-10-08 · 9 min read
Chapter 58 ended with a question I could answer from memory: how much RAM does a 1M-context session actually take? About 105 GB of 125, it turned out, measured by hand with free and a stopwatch. That is the wrong way to hold that number. The stack on this machine — two GPUs, a model server, three router variants, a chat frontend, an image pipeline — had no instrument panel, and every conversation about it was powered by spot checks.
So the plan doc said: Prometheus and Grafana, badly wanted. What followed was a good example of how I use an agent for infrastructure work now: research first, decisions recorded, a written plan parked for a clean session, and then an execution pass where the plan met reality and lost three arguments.
The plan was written before the first container
The monitoring plan lives in the repo’s orbit as a markdown file, and it was finished — decisions made, research questions numbered R1 through R9 — before a single quadlet existed. Six decisions came from a working session, not from me guessing:
- Prometheus and the exporters at boot; Grafana on demand like every other web app.
- Grafana on the LAN, login required.
- Retention: 180 days, capped at 20 GB.
- For ComfyUI metrics: research the existing add-on; if it does the job, don’t build our own.
- Logs: lightweight, but weigh the options.
- Everything a rootless podman quadlet. No host packages, not even for monitoring.
The R-questions were the interesting part. Each one was a fact the design depended on that nobody had verified yet: does the llama.cpp router’s /metrics endpoint autoload models (and therefore silently keep a 12 GB model resident because we wanted a gauge)? Does a scrape cost measurable decode throughput? Can a rootless container read this machine’s journal at all?
A plan that lists its unknowns as numbered experiments is a plan an agent can execute without judgment calls. That was the point of writing it.
Research pass: nine questions, three surprises
The execution session started by answering the R-questions against live services, read-only, while the model server that runs this very agent kept serving on the 5090.
The scrape is free. The worry was that rendering /metrics during decode would steal throughput. Measured: 220–231 tok/s steady state while scraping every five seconds. Under 1%. The concern had been real for older engines; it is not real for this one.
The router endpoint is safe, but only with the right spell. Bare /metrics on the llama.cpp router returns 400. /metrics?model=X&autoload=false returns the model’s metrics if it is loaded — and a polite 400 without loading it if it isn’t. One flag stands between a dashboard and a model that never sleeps. The plan had anticipated exactly this failure mode, which is why the flag was non-negotiable in the generated config.
The GPU exporter is a tourist. It reads NVML through the driver, holds no VRAM, and reports both cards keyed by UUID. It must not be treated as a GPU service by the arbiter that owns card assignments — so it carries no gpu field in the registry, and a policy test enforces that one exception rather than letting it slide.
The logs bake-off: two stacks, side by side, in throwaway containers
The plan refused to pick a log stack on reputation. VictoriaLogs + Fluent Bit versus Loki + Alloy, both run live against this machine’s journal, compared on idle memory, config size, and whether the container name arrives as a queryable field.
VictoriaLogs + Fluent Bit won, but not for the reasons anyone would have guessed. It won because the other one needed surgery:
- Loki refused to start until its data directory was world-writable, then throttled the journal backfill with a default ingestion limit that had to be raised, and then Alloy’s journal source needed a relabel stage to keep the container name — which it still dropped.
- Fluent Bit had its own trap, described below.
The lesson generalises: “Grafana’s native pair” is only native on the happy path. The lightweight option was the one that needed no exceptions.
The honest bit: three pitfalls the plan could not have known
The plan was good and still got three things wrong, because they are facts about this machine, not about monitoring in general.
Fluent Bit 4.0 reads zero records from this journal. Not an error — zero. The user journal here is ZSTD-compressed (systemd 262), and the 4.0 input silently returns nothing. 4.2 reads it fine. A pipeline that ingests nothing looks identical to a quiet system for about a week.
--userns=keep-id breaks journal access. The stack’s usual convention maps the container user to the host user. Here the journal’s ACL grants read to px, and the container’s root already maps to px — so keep-id maps the process to nobody instead, and the input again reads zero records, again without an error. The fix was to not use the convention, and the quadlet now carries a comment explaining why, because a future reader will try to “fix” it back.
Two images run as nobody and cannot read their own mounted config. Prometheus and node-exporter both ship USER nobody; the stack’s config dirs are mode 700 (they hold API keys). The exporter needs --user=0, which rootless podman maps to px — the same trick the journal needed, arrived at from the opposite direction.
There was a fourth, smaller one: the VictoriaLogs Grafana plugin wants the LogsQL in a field called expr, not query. And a fifth, caught only because I opened the dashboards myself: the vendored community dashboards still carried the import-wizard placeholder ${DS_PROMETHEUS} as their datasource uid — 47 references in the Strata one, 20 in the Podman one. Every panel pointed at a datasource that does not exist and rendered politely empty. My verification pass had replayed the queries of the dashboards I wrote; the vendored ones passed the same substitution script, but the script only knew one placeholder form. The fix is one sed pattern; the lesson is that “vendored and pinned” still needs an eyeball on the rendered result.
Every panel query in the dashboards I authored was replayed through Grafana’s own datasource API before the work was called done — twenty-four queries, all returning data, zero errors, verified by machine rather than by looking at the screen. The machine just cannot see placeholder datasources.
The registry is the source of truth, one level deeper
The stack already had one rule: services.json describes every service, and quadlets, the CLI and the bar widget are generated from or checked against it. Monitoring extends that rule instead of adding a second center of truth. scripts/render-prometheus.py reads the registry and emits the scrape targets, the blackbox probes (one per registered health URL), the fluent-bit pipeline and the recording rules that turn podman’s container state into ailab:service_running{service,gpu,tier}.
Registering a service puts it under monitoring. Forgetting to register it makes it invisible in a way that is now a test failure rather than a silent gap. The same generator writes a textfile-collector map so the dashboards know which container belongs to which service — the join that answers “what was running when RAM hit 105 GB”.
What the panel actually shows
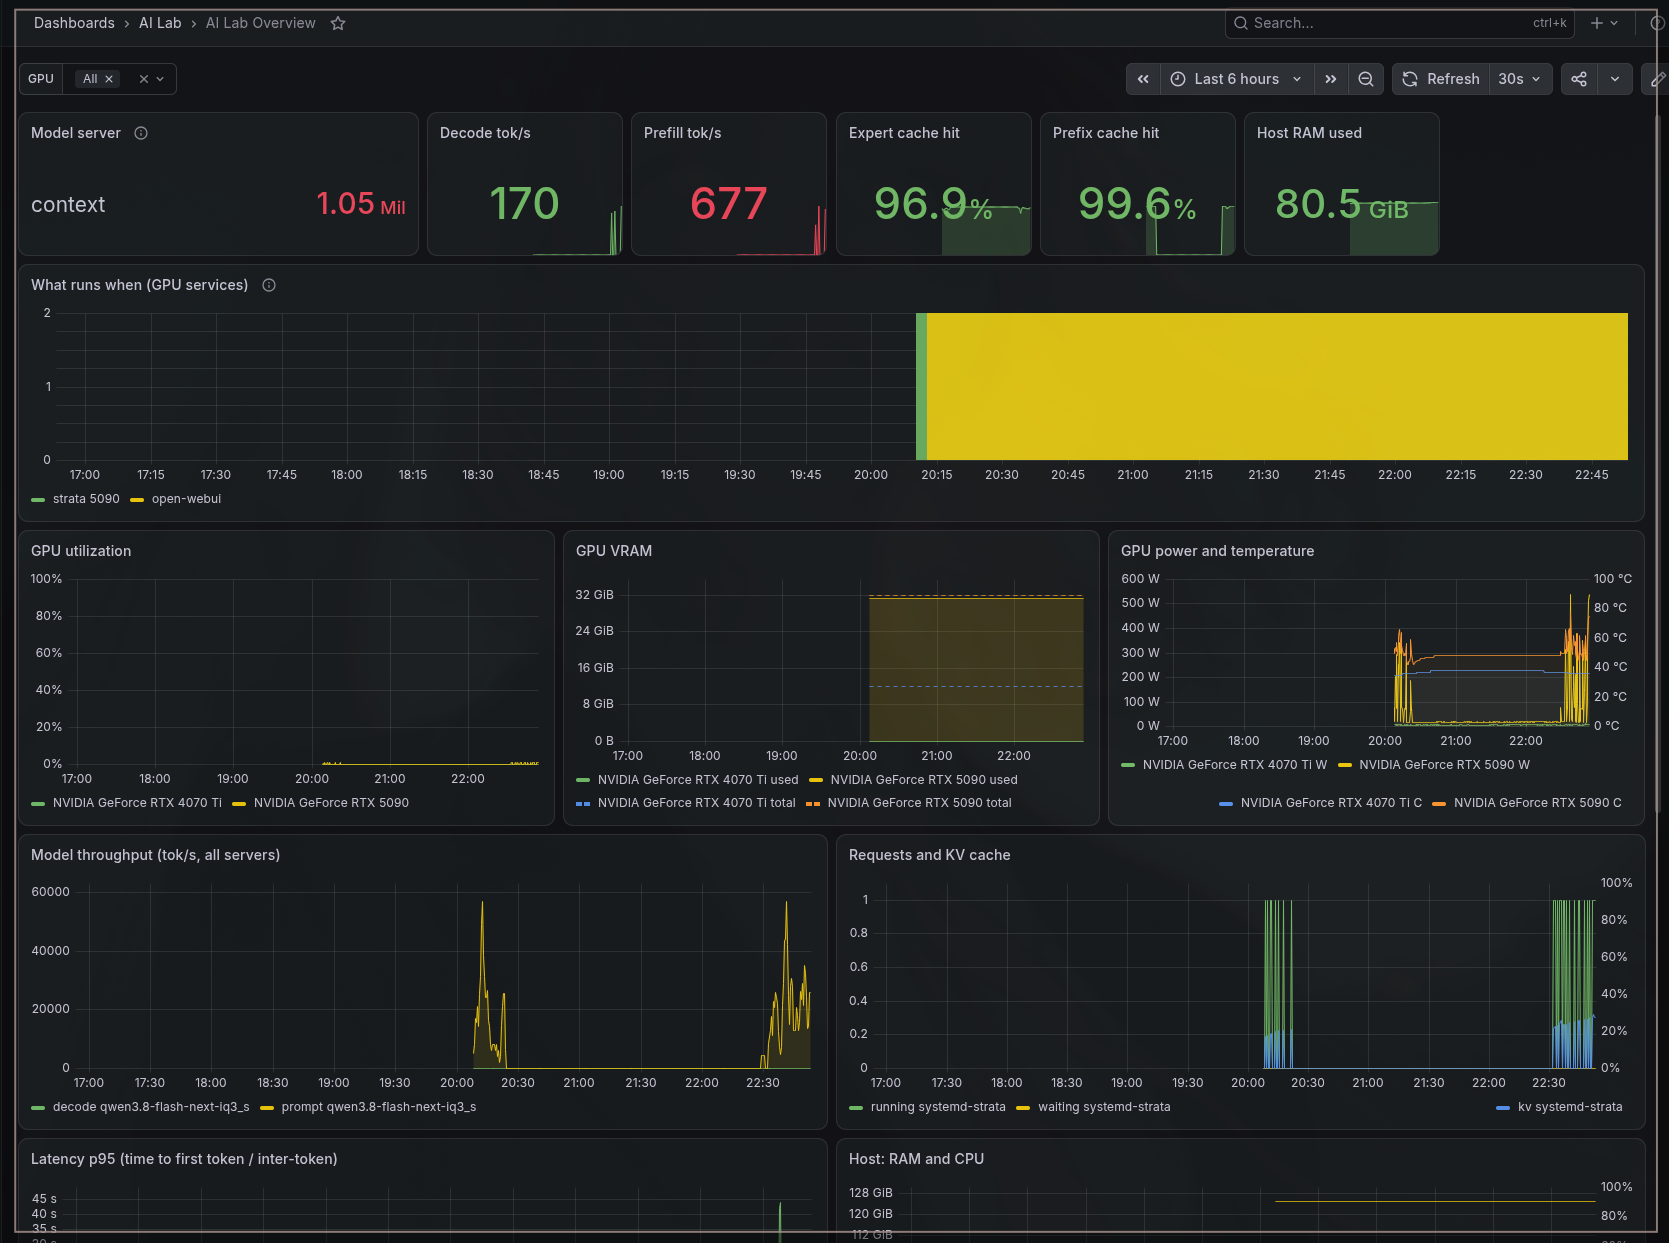
The Overview is the one I actually look at. The stat row answers the phone-glance questions: which model answers on 11434 and at what context (1.05 Mil right now), decode and prefill tok/s, the two cache hit rates that explain why long sessions feel instant, host RAM with thresholds set from the duo numbers in chapter 58.
Below it, the timeline: every GPU service as an on/off band across the day. This is the panel that replaces the spot checks — it knows which strata variant ran when, because the podman state and the registry map are joined in Prometheus, not remembered by me. The GPU row joins the exporter’s UUID-keyed series against nvidia_smi_gpu_info, so the legends read “RTX 5090” and “RTX 4070 Ti” instead of hexadecimal; VRAM shows used against a dashed total, which is the honest way to watch a 32 GB card fill up. The health grid is 22 tiles from blackbox probes, with a deliberate semantic: a stopped service shows no tile, not a red one. Red means “registered, running, and not answering” — the only state that deserves an alert. And the logs panel at the bottom queries VictoriaLogs with the container name as a stream field, so a metric spike and the same window’s logs sit on one screen.
The rest of the fleet is standard kit, provisioned from git the same way:
Node Exporter Full (dashboard 1860) covers the host — and on this machine its btrfs collector turns out to be quietly excellent: commit times, device errors, reserved space, all from the rootless container with --path.rootfs=/host. The NVIDIA dashboards (14574/25547) go deeper than my Overview row: per-card clocks, throttling reasons, fan curves, ECC counters — all fed by the same tourist exporter that holds no VRAM.
The dashboard that already existed
One honest footnote: the model server ships its own live monitor page, and it is good. Strata’s /#monitor shows model state, decode and prefill speed, GPU load, VRAM with the expert-cache count, PCIe generation, context fill and a recent-requests table — real-time, no Prometheus in the loop.
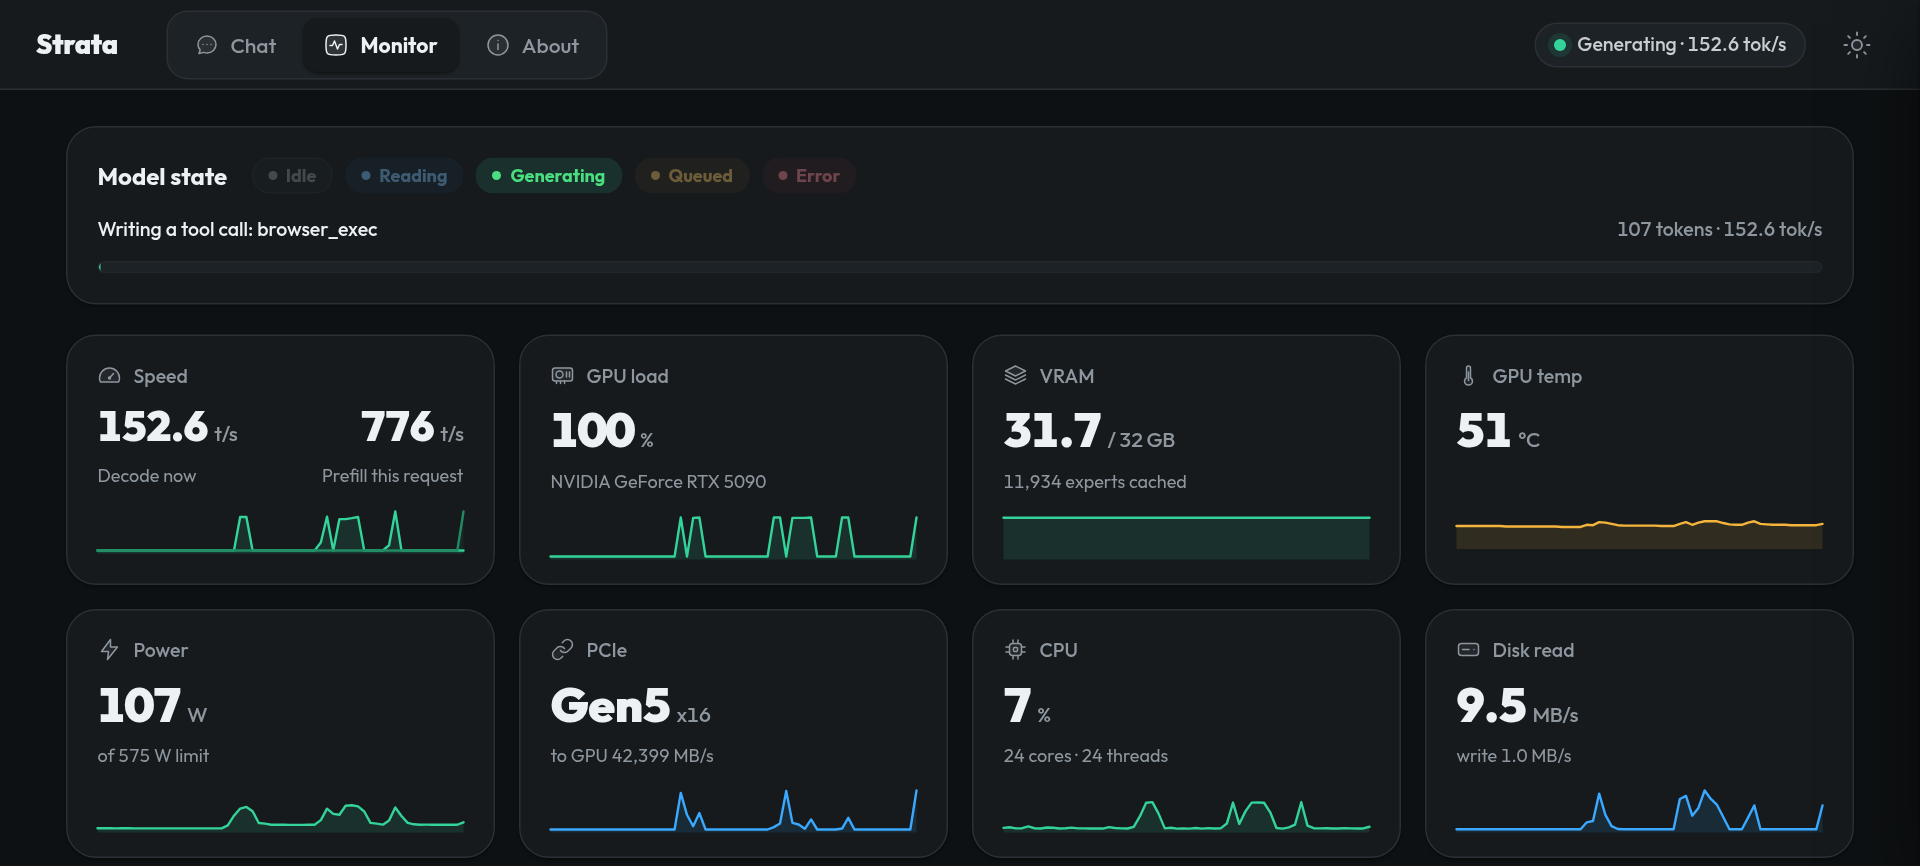
The Grafana side is the Strata dashboard upstream already provides (vLLM-named series: requests running/waiting, TTFT and inter-token histograms, prefix cache, spec-decode drafts), and it renders the same data as history instead of as a live readout.
That is the actual division of labour: the engine’s own page answers “what is it doing right now”, the stack answers “what was it doing at 14:20 when the RAM line went up”. Both were worth having; only one of them keeps history.
What the agent did and what it didn’t
Worth stating plainly, because the stack is the agent’s own body: the model server running this session was never restarted, never reconfigured, never touched. The execution pass was additive — new quadlets, new registry entries, generated configs. The one interaction with the inference container was read-only scraping, measured at under 1% cost. The dashboard that watches the machine is watched by the same rule that keeps the machine’s parts from interfering with each other: monitoring must never change what it measures.
The plan doc’s status line now reads IMPLEMENTED, with a list of the places reality overruled it. That list is the most reusable part of the whole exercise — the next agent, on the next machine, starts from the corrected map instead of the original guess.